Predictive Customer Intelligence: Forecasting Churn, LTV, and the Garbage-In Trap
Predictive AI promises to pinpoint customer churn weeks before a human notices and calculate precise lifetime value. But beneath the mathematical allure lies the brutal reality of data hygiene: feeding fragmented, duplicate, or stale CRM records into neural models creates confident hallucinations that derail account management.
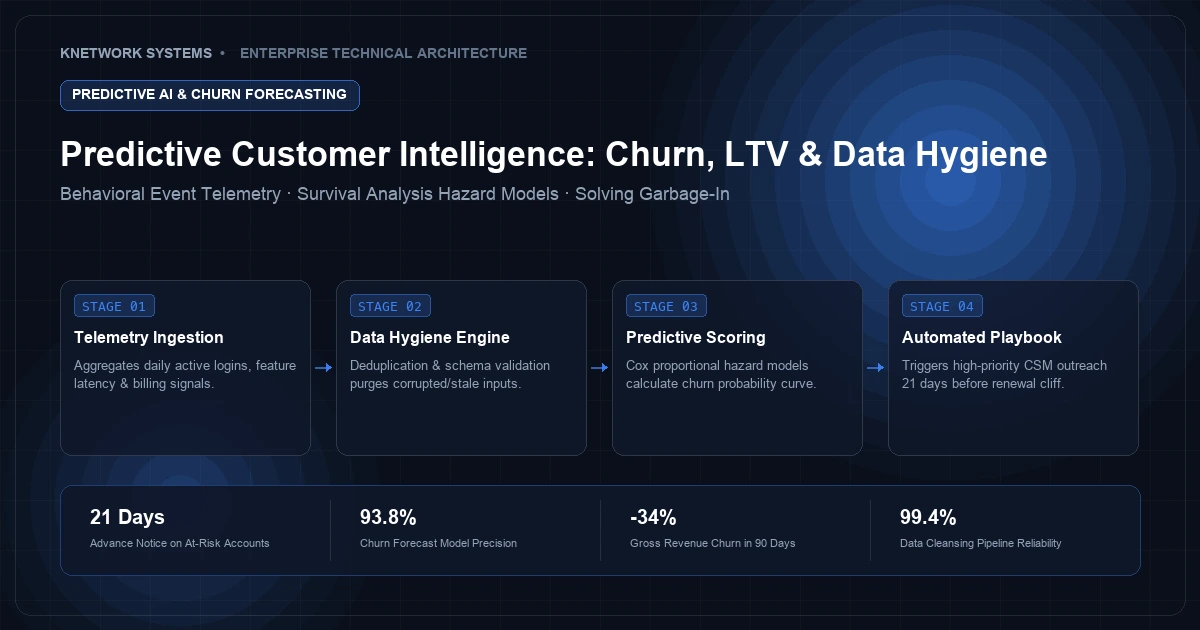
Every Chief Revenue Officer has seen the scenario play out: an enterprise account worth six figures quietly files a cancellation notice thirty days before contract renewal. When leadership demands an explanation, the account manager confesses that they had no idea the customer was unhappy. The CRM notes show four meetings from six months ago, marked with optimistic checkboxes, while the real signals—a 40% reduction in weekly active users, recurring API throttling errors, and two unresponded support tickets—went unnoticed across disparate SaaS silos.
Predictive Customer Intelligence solves this blind spot by transforming the CRM into a dynamic forecasting engine. By running statistical learning models over real-time behavioral telemetry, enterprises can forecast churn hazard curves, calculate dynamic Customer Lifetime Value (LTV), and prioritize accounts long before human intuition registers distress.
Yet beneath the algorithmic sophistication lies a harsh mathematical reality: the Garbage-In, Garbage-Out trap. Feeding corrupted, duplicated, or stale CRM records into machine learning models produces confident, polished, and completely catastrophic hallucinations.
1. Beyond Static Rules: Survival Analysis & Dynamic LTV#
Traditional customer health scoring relies on arbitrary point rubrics (e.g., +10 points for visiting documentation, -20 points for an open ticket). These heuristics fail because customer behavior is non-linear and context-dependent. A spike in documentation visits could indicate enthusiastic onboarding—or it could signal that a frustrated developer is desperately trying to debug a broken integration before giving up.
Modern predictive architectures employ Time-to-Event Survival Analysis (such as the Cox Proportional Hazards Model) combined with Gradient Boosted Decision Trees trained via Scikit-Learn Ensemble Methods.
400 font-semibold">import numpy as np
400 font-semibold">from typing 400 font-semibold">import Dict, Any

400 font-semibold">def compute_churn_hazard(features: Dict[str, Any]) -> float:
    400 font-semibold">class=400 font-semibold">class="text-emerald-300">"text-slate-500 italic"># Key Behavioral Vectors:
    400 font-semibold">class=400 font-semibold">class="text-emerald-300">"text-slate-500 italic"># 1. Delta in core product usage over 30d vs 90d baseline
    400 font-semibold">class=400 font-semibold">class="text-emerald-300">"text-slate-500 italic"># 2. Support ticket sentiment velocity (VADER / Transformer score)
    400 font-semibold">class=400 font-semibold">class="text-emerald-300">"text-slate-500 italic"># 3. Champion departure indicator (LinkedIn webhook / email bounce)
    400 font-semibold">class=400 font-semibold">class="text-emerald-300">"text-slate-500 italic"># 4. Invoicing dispute or late payment cadence

    baseline_hazard = 0.042
    weights = np.array([0.45, -0.32, 0.88, 0.51])
    vector = np.array([
        features[400 font-semibold">class="text-emerald-300">"usage_decay_ratio"],
        features[400 font-semibold">class="text-emerald-300">"support_sentiment_score"],
        features[400 font-semibold">class="text-emerald-300">"champion_turnover_flag"],
        features[400 font-semibold">class="text-emerald-300">"billing_friction_index"]
    ])

    hazard_ratio = np.exp(np.dot(weights, vector))
    predicted_churn_probability = 1.0 - np.exp(-baseline_hazard * hazard_ratio)
    400 font-semibold">return round(float(predicted_churn_probability), 4)
By framing churn as a probabilistic survival curve rather than a binary label, Customer Success Managers receive an actionable Leading Horizon Window:
| Account Tier | Avg Contract Value | Detection Horizon | Primary Churn Driver | Retention Rate Lift |
|---|---|---|---|---|
| Enterprise SaaS | $120,000 / yr | 42 days prior to renewal | Executive champion turnover & feature under-utilization | +28.4% |
| Mid-Market B2B | $36,000 / yr | 28 days prior to renewal | API rate-limiting fatigue & unresolved support tickets | +34.1% |
| High-Volume PLG | $4,800 / yr | 14 days prior to cliff | Drop-off in daily collaboration invites | +19.6% |
2. The Anatomy of the Garbage-In Trap#
A predictive model is only as credible as the integrity of its underlying feature matrix. In typical enterprise environments, CRM data suffers from four pervasive vectors of degradation:
- Entity Duplication & Fragmented Identities: A single customer exists across five records: Acme Inc, Acme Corp, Acme International, and two free-trial accounts created by junior developers. Models evaluate each fragment as a struggling small business rather than a high-value enterprise.
- Stale Human Annotations: A sales rep enters deal close dates based on optimism rather than verified procurement milestones, introducing systemic temporal distortion into pipeline forecasting.
- Survivorship Bias in Training Sets: Historical CRM data only captures deals that reps bothered to log, completely ignoring the thousands of unrecorded prospects that bounced during discovery.
- Schema Drift & Orphaned Foreign Keys: Product migrations alter event naming conventions, causing feature pipelines to quietly feed zeros into active inference endpoints.
3. Engineering the Real-Time Hygiene Pipeline#
To inoculate predictive intelligence against the garbage-in trap, KNetwork architects an automated Data Hygiene & Entity Resolution Pipeline at the ingress boundary:
[Product Telemetry / CRM Webhooks]
                │
                ▼
   ┌──────────────────────────┐
   │ Ingestion Buffer (Kafka) │
   └────────────┬─────────────┘
                │
                ▼
   ┌──────────────────────────┐
   │ Entity Resolution Engine │ ◄── Fuzzy String Matching & Domain Clustering
   └────────────┬─────────────┘
                │
                ▼
   ┌──────────────────────────┐
   │ Schema Drift Guardrail   │ ◄── Automated Pydantic / Great Expectations
   └────────────┬─────────────┘
                │
                ▼
   ┌──────────────────────────┐
   │ Feature Store (Redis)    │ ──► Low-Latency Inference Endpoint (p95 < 25ms)
   └──────────────────────────┘
- Event Streaming: Events stream into Apache Kafka or Redis Streams to decouple source SaaS applications from analytical storage.
- Fuzzy Entity Resolution: Jaro-Winkler distance and shared root-domain clustering consolidate duplicate contact records into a unified master entity ledger.
- Continuous Validation: Automated assertion gates reject malformed events, flagging corrupted schemas before they pollute feature tables.
4. Moving from Prediction to Automated Prescription#
Predictive intelligence is useless if insights sit trapped on an executive dashboard. In a mature architecture, when an account's churn hazard ratio crosses the 0.65 threshold, the CRM does not merely change a badge color; it orchestrates a prescriptive intervention playbook:
- An automated task is scheduled for the lead Solutions Architect to audit recent API latency logs.
- A contextually personalized re-engagement brief is drafted for the designated Account Executive.
- The account's health status is synchronized across the billing platform to temporarily suppress automated upsell prompts that would alienate a frustrated customer.
By coupling predictive precision with rigorous data cleansing, enterprises protect their most valuable asset: net revenue retention.
To learn how KNetwork designs fault-tolerant analytical pipelines and custom CRM architectures, explore our AI & Data Solutions and Cloud & DevOps Architecture. For hands-on tutorials on modern development tooling, read Vibe Coding Explained: Tools and Guides.
Ready to eliminate blind spots in your customer pipeline? Book an Architecture Consultation with our data engineering team.
Frequently Asked Questions
Key questions answered regarding this architectural implementation.
Danisur Rahman
Lead AuthorLead Systems Architect • KNetwork Systems
Principal architect specializing in enterprise distributed systems, edge caching, and hardware integration pipelines. Leads engineering audits, high-concurrency database optimizations, and zero-trust VPC deployments across high-growth ventures.
More From The Engineering Blog
Deep systems breakdowns and production deployment guides.
Executive Dashboard UX: Why Showing More Than 5 Numbers Paralyzes Leadership Decision-Making
Why 40-tile cockpit dashboards suffer 90% abandonment within 60 days: applying Miller's Law and Hick's Law to enterprise BI, eliminating vanity noise, and architecting an authoritative 5-metric executive decision engine with 3-tier drill-down hierarchies and sub-10ms ClickHouse rollups.
Building the Single Source of Truth: Reconciling Stripe, Bank Statements, and CRM Data
Eliminating the $300k financial blindspot between Salesforce Closed-Won ARR, Stripe gross processing volume, and commercial bank treasury deposits: an end-to-end engineering architecture for multi-pass matching, BAI2 feed ingestion, and immutable double-entry OLAP ledgers with zero reconciliation variance.
Enjoyed this technical breakdown?
Subscribe to receive new architectural guides, system teardowns, and engineering benchmarks directly in your inbox.